CPR Trend Report
CPR Trend report options
Use the CPR Trend report to see aggregated CPR trends based on different types. Remember, a case is typed Simulated by either auto-detection on upload from a device specified as a training device (configured on the Settings page), or by a user manually marking the case as Simulated.
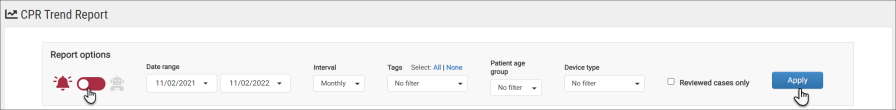
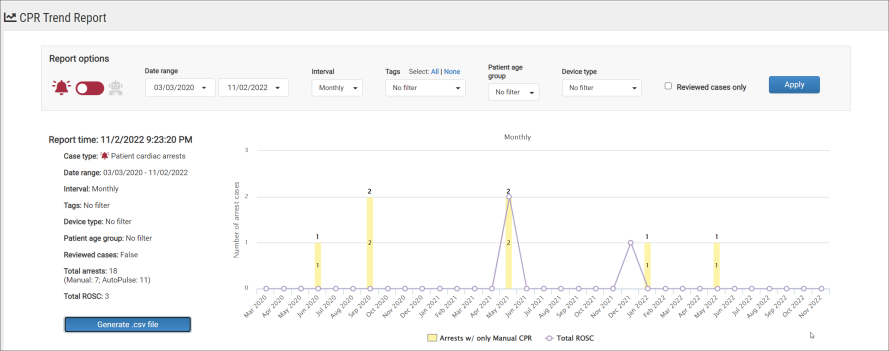
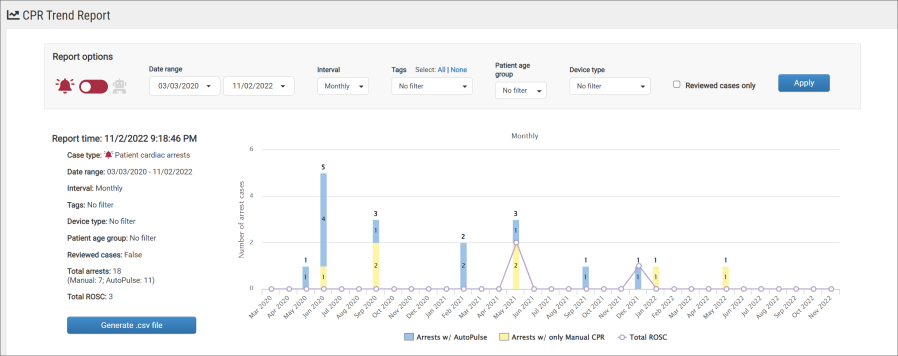
With Case Type Identification enabled, you can type cases as Clinical (real cardiac arrest CPR) and Simulated (training CPR). To see real cardiac arrest performance, move the red "Patient Cardiac Arrest" alarm toggle to the bell icon  , enter the criteria, and then click Apply.
To see simulated case types that contain CPR, move the toggle to the right towards the purple "Simulated Cardiac Arrest" robot icon  and then click Apply. Again, no ventilation - only CPR cases are included in this setting.
If AutoPulse is enabled in your system, it will be represented by blue bars. Yellow bars represent manual CPR cases. ROSC displays as a line. Click the legend to hide or show the respective data in the chart.
CPR Trend report with AutoPulse OFF.
CPR Trend report with AutoPulse ON.
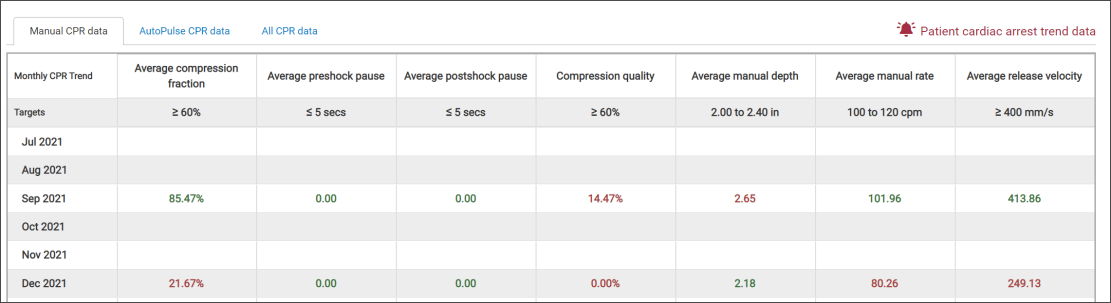
The table
The table below the graph displays trend data for CPR quality. Your administrator sets the target ranges for quality metrics on the Settings page. Green values show the number of cases that fell within acceptable target range and red values represent the number of cases that fell within the unacceptable target range.
When AutoPulse is ON, the CPR Trends table displays three tabs:
-
Manual CPR data tab: This is the original CPR Trends chart that includes the following metric breakdowns.
-
Average manual depth
-
Average manual rate
-
Average release velocity
-
Average compression fraction
-
Average preshock pause
-
Average postshock pause
-
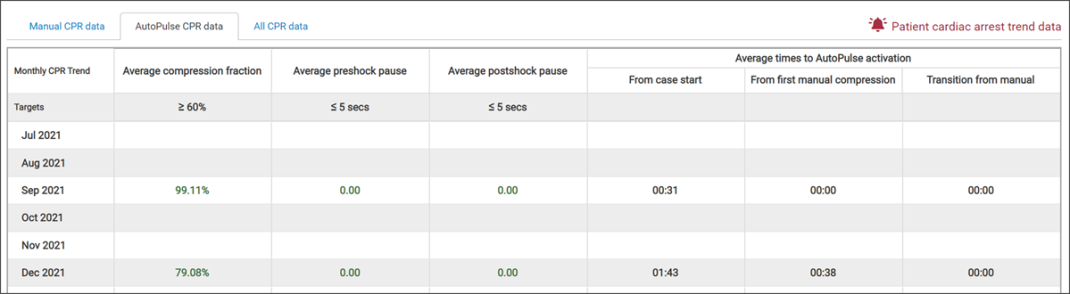
- AutoPulse data tab:This chart displays additional metrics for AutoPulse cases alone. This allows users to isolate their AutoPulse performance and focus on deployment times pauses in CPR where AutoPulse was involved and overall CCF.
Average compression fraction
Average preshock pause
Average postshock pause
Average times to AutoPulse activation (new!)
From case start
From first manual compression
Transition from manual
-
All CPR data tab: This chart provides additional metrics that include AutoPulse and Manual CPR combined. This allows users to see overall metrics for the case where manual CPR may have been initiated and then AutoPulse CPR deployed.
-
Average compression fraction
-
Average preshock pause
-
Average postshock pause
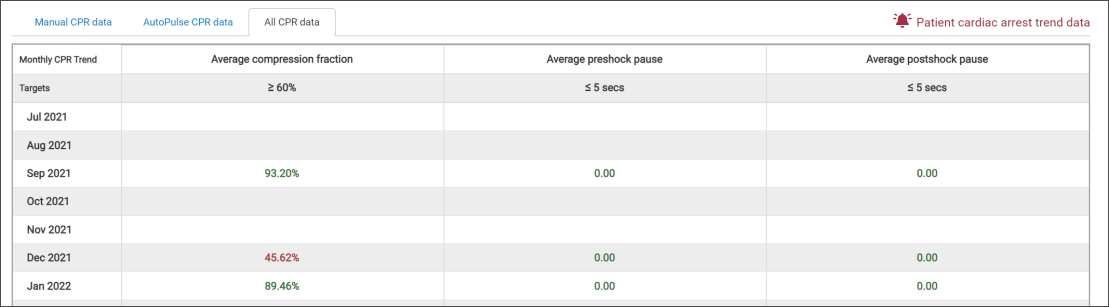
-
If AutoPulse is OFF, only the manual CPR data grid displays.
Each CPR Trends value in this table represent aggregate values for the cases selected by the filter options on this page.
Targets: Targets are determined by your System Administrator and can be changed on the Settings page (see CPR Quality Settings)
Red values: Indicate that the time interval value did not meet the target as shown in the Targets column
Green values: Indicate that the target was met for that time interval
Percentages: Calculated using individual case totals to determine a daily weighted average
Compression quality: Percentage of selected cases that met both the depth and rate targets
Average CPR depth: Average compression depth determined by averaging the averages of each selected case
Average CPR rate: Average compression rate determined by averaging the averages of each selected case
Average release velocity: Average release velocity determined by averaging the averages of each selected case
Average compression fraction: Average chest compression fraction (CCF) determined by averaging the averages of each selected case
Average pre-shock pause: For the selected cases containing pre-shock pauses, this is the average pre-shock length in time for those cases
Average post-shock pause: For selected cases containing post-shock pauses, this is the average post-shock length in time for those cases
It is important to note that any changes to compression rate targets or compression depth targets can take up to 24 hours or more to reflect in the CPR Trend report.
If settings are still pending when you run the CPR Trend report, rows that contain data that maybe "out-of-date" will display a corresponding ‘!’ notice.
Report parameters and filters
The CPR Trend report displays trends in CPR data based on dates and parameters that you choose.
-
Select a date range:
-
Today
-
Yesterday
-
Last 7 days
-
Current month
-
Last 3 months
-
Last 6 months
-
Year to date
-
Last calendar year
-
Custom: Use to select a date range of your choosing.
-
- Select an interval from the drop-down list. Depending on the date range's length of time, CaseReview automatically restricts the interval. For example, if you pick "Last calendar year", you will not be allowed to set the interval to "Daily." Restricting the interval prevents the returned data from being too granular with too many rows.
Daily – Trend chart will display the past seven days to date
Weekly – Trend chart will display the past seven weeks to date
Monthly – Trend chart will display the past seven months to date
Quarterly – Trend chart will display the past seven quarters to date
Yearly - Trend chart will display all of the current year, then all of the six previous years. For example, if you selected yearly at the beginning of August, you would see data from that date back through January of that same year. Then you would see data from January - December of the previous six years.
-
Filters:
-
Tags: Select one or more tags to show trend data from the cases with those tags applied to them. Click All to apply all the tags to the report. Click None to remove all selected tags. If your company is using a lot of tags, try clicking All and then removing those you don't want to apply.
-
Patient age group: Choose adult, pediatric, infant, or any combination of the three. To set the patient to pediatric or infant, see marking a case as infant or pediatric.
-
Device type: Click the Device type field to select a device from the list. Multiple devices can be selected at once. Devices include:
-
3, Plus, and Pro AED 3
-
E, M, R, and X Series
-
M and MD Propaq
-
ZOLL M2
-
Unknown
-
-
Only cases marked as reviewed: Check this box to show only trend data from cases marked “Reviewed” on the CPR Performance.
-
- Click Apply.
A summary of the parameters and filters that you selected displays on the left side of the graph.
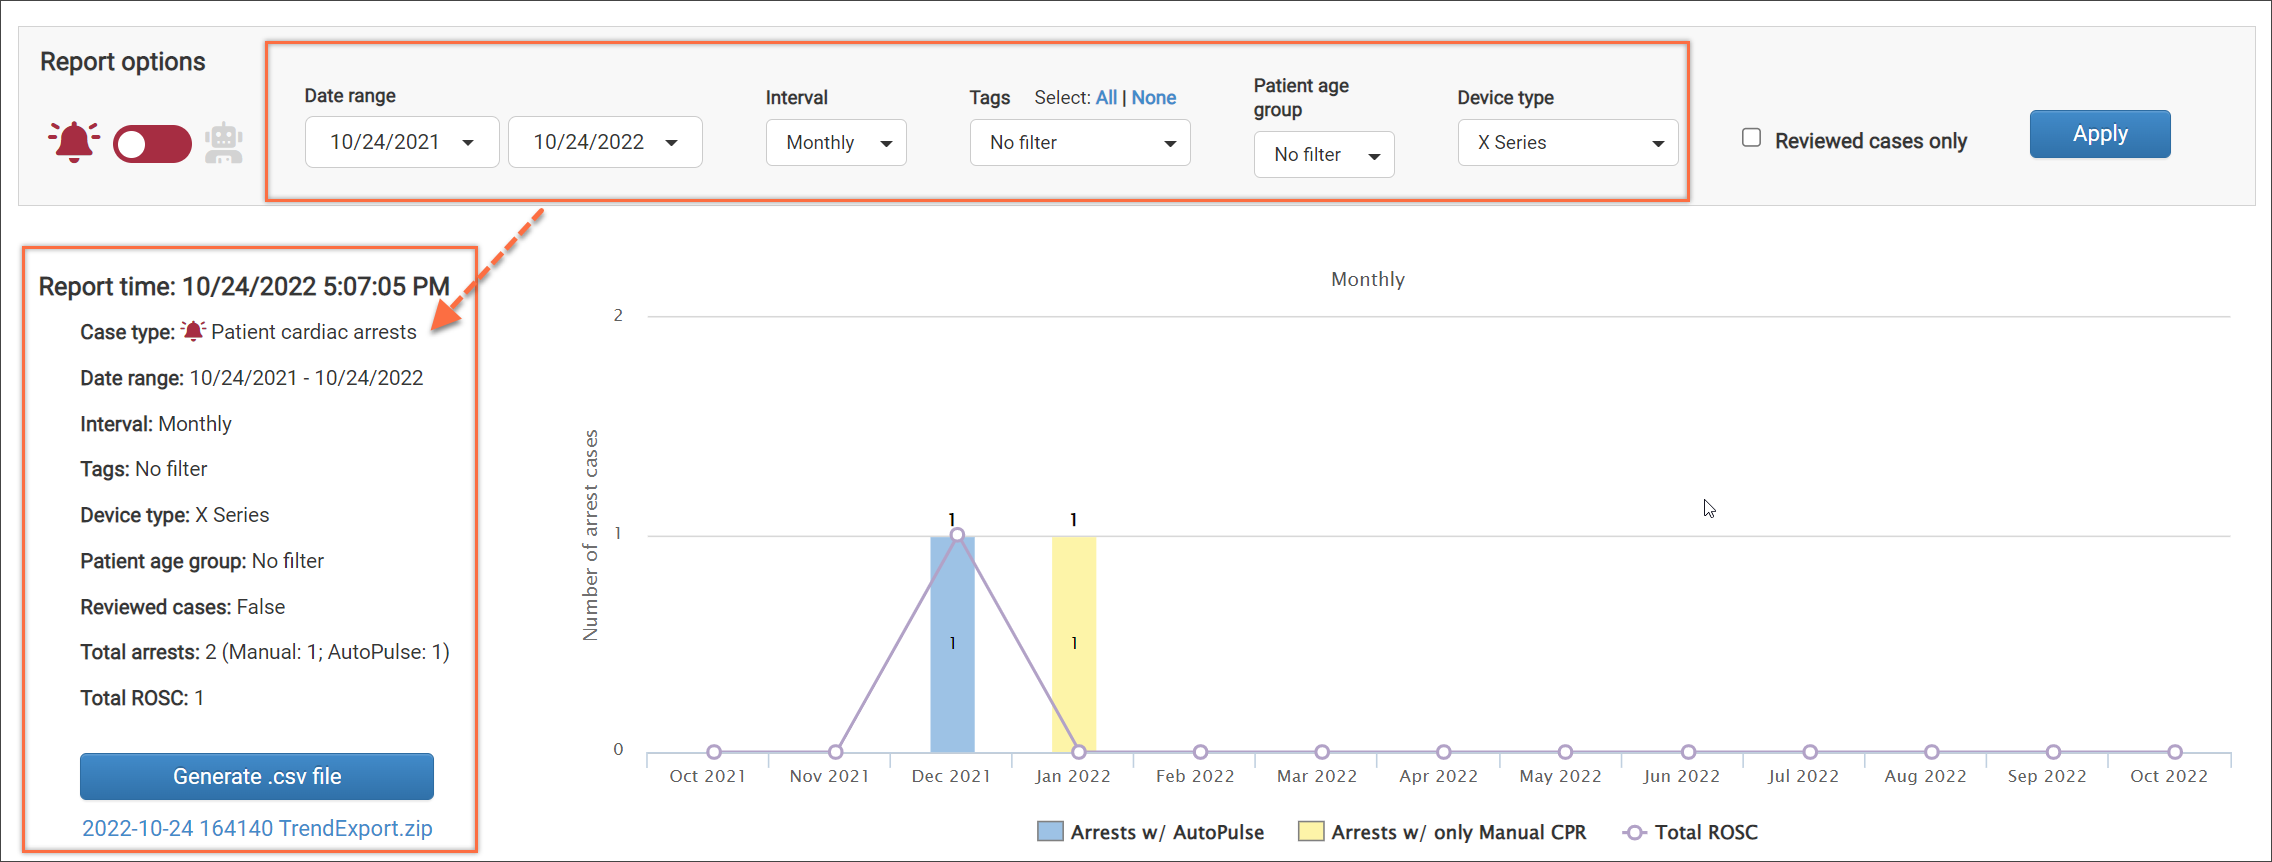
The graph displays the trends in arrests and ROSC. Mouse over a point in the graph to see the point value.
Generate.csv file
The CPR Trend exports .csv report is based on the toggled information (Patient Cardiac Arrest or Simulated Cardiac Arrest) and the date range that you selected. For example, if the toggle is set for Patient Cardiac Arrest and the date range is for the last six months, only the last six months of Patient Cardiac Arrest cases will be exported in the report. If a custom date range is selected for the display, than only the data for Patient Cardiac Arrest cases that falls within that custom date range will be exported in the report.
Note that the interval filter on the CPR Trends display does not affect the CPR Trends export (.csv) report. For example, if you select a six-month date range with a weekly interval, the chart and data table will reflect that interval. However, the exported report will include all CPR cases from the selected date range, listed by exact date, without applying the weekly interval. The .csv report ignores the interval setting from the CPR Trends display.
To generate the export:
Click Generate.csv file to download the CPR Trend reports onto your computer. The resulting .zip file contains three separate files, TrendExport.csv, FilterOptions.txt, and AdvancedTrendExport.csv.

-
The report must contain at least one case. If you have less than one case, adjust the filter options to expand your results.
-
The .csv file is limited to 1000 cases. If you have more than 1000 cases, adjust the filter options to narrow your results.
-
When the report generates, you will see the zip file display under the generate button.
TrendExport.csv
The TrendExport.csv report may contain the following information:
- Generated filename
- Uploaded filename
- Case date
- Power on time
- Patient age group
- Device type
- In target depth (%)
- Average compression depth in inches
- In target rate (%)
- Average compression rate (cpm)
- Compressions in target (%)
- Compression fraction - CCF (%)
- Average length of post-shock pauses (sec)
- Average length of pre-shock pauses (sec)
FilterOptions.txt
- Date range
- Interval
- Tags
- Patient age group
- Only cases marked as 'Reviewed'
AdvancedTrendExport.csv
- Generated filename
- Uploaded filename
- Patient ID/MRN
- Case date
- power on time
- Case duration
- Pads on time
- Device unit/ID
- Device type
- Patient age group
- Patient age
- Gender
- Reviewed Y/N
- Number of shocks delivered
- Average length of per-shock pauses (sec)
- Minimum pre-shock pause
- Maximum pre-shock pause
- Number of pre-shock pauses < 5 sec
- Number of pre-shock pauses 5 - 10 sec
- Number of pre-shock pauses > = 10 sec
- Average length of post-shock pause (sec)
- Minimum post-shock pause
- Maximum post-shock pause
- Number of post-shock pauses < 5 sec
- Number of post-shock pauses 5 - 10 sec
- Number of post- shock pauses > = 10 sec
- Average compression depth (inches)
- In target depth (%)
- Depth target (inches)
- Average compression rate (cpm)
- In target rate (%) Rate target
- Compressions in target (%)
- Compression fraction - CCF (%)
- Average release velocity (mm/sec)